![Uptime Kuma - monitoring tool for services [ENG 🇬🇧]](/images/uptimekuma.png)
🇵🇱 Przejdź do polskiej wersji tego wpisu / Go to polish version of this post
Table of contents:
In the title, I wanted to keep it brief, so I used the word services, which I would like to expand upon here as websites, applications, and servers, basically anything available on the internet that may, for some reason, not be functioning properly. The tool used to monitor these things is Uptime Kuma. It is a self-hosted solution that is incredibly easy to set up and manage, yet highly functional.
How to set up Uptime Kuma
Running Uptime Kuma on your server can be done in various ways. One of them is by accessing this tool in the application library of Yunohost. However, in this post, I will show you how to run this tool as a Docker container, specifically using the method I recently described - Portainer.
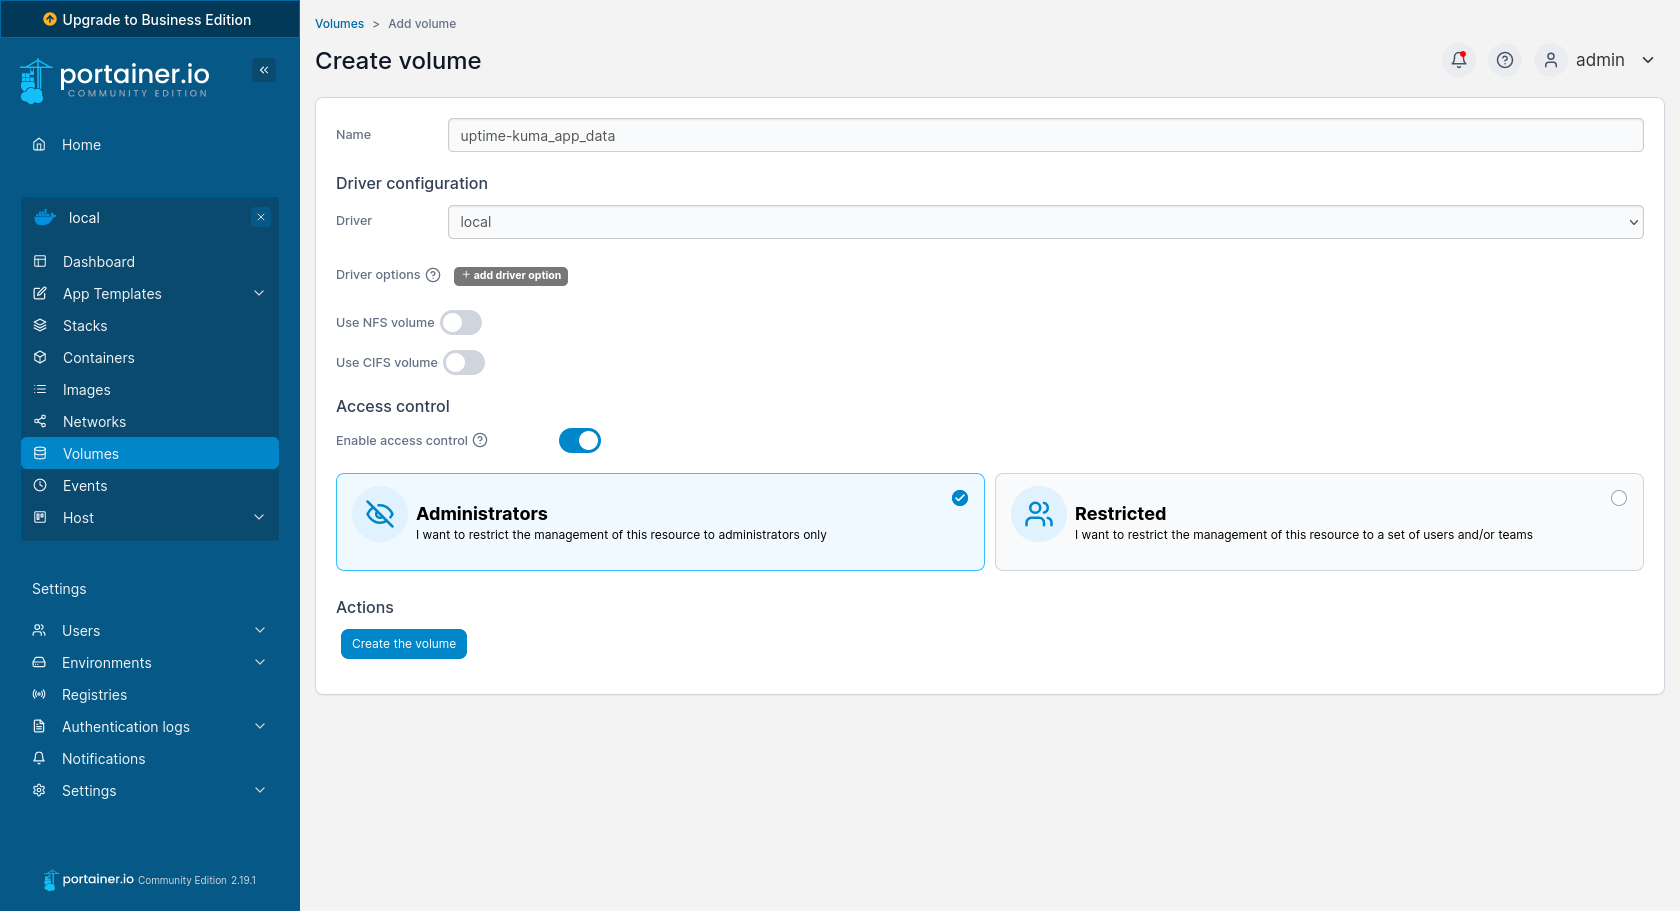
Firstly, you need to create the required volume. The Uptime Kuma documentation states that you need to mount the path /app/data. Therefore, let’s create a volume named uptime-kuma_app_data.
Now we can proceed to create the container:
-
Name - Uptime-kuma
-
Image - louislam/uptime-kuma:latest
- Manual network port publishing (host -> container):
- 3001 -> 3001
- Volumes (container -> volume):
- /app/data -> uptime-kuma_app_data - local
- Restart policy - Unless stopped
All these settings are confirmed by clicking the Deploy the container button. If someone doesn’t like Portainer, the same result can be achieved using the following commands:
docker volume create uptime-kuma_app_data
docker run -d \
-p 3001:3001 \
-v uptime-kuma_app_data:/app/data \
--name Uptime-kuma \
--restart unless-stopped \
louislam/uptime-kuma:latest
The service, once activated, will be accessible at the following address:
http://localhost:3001
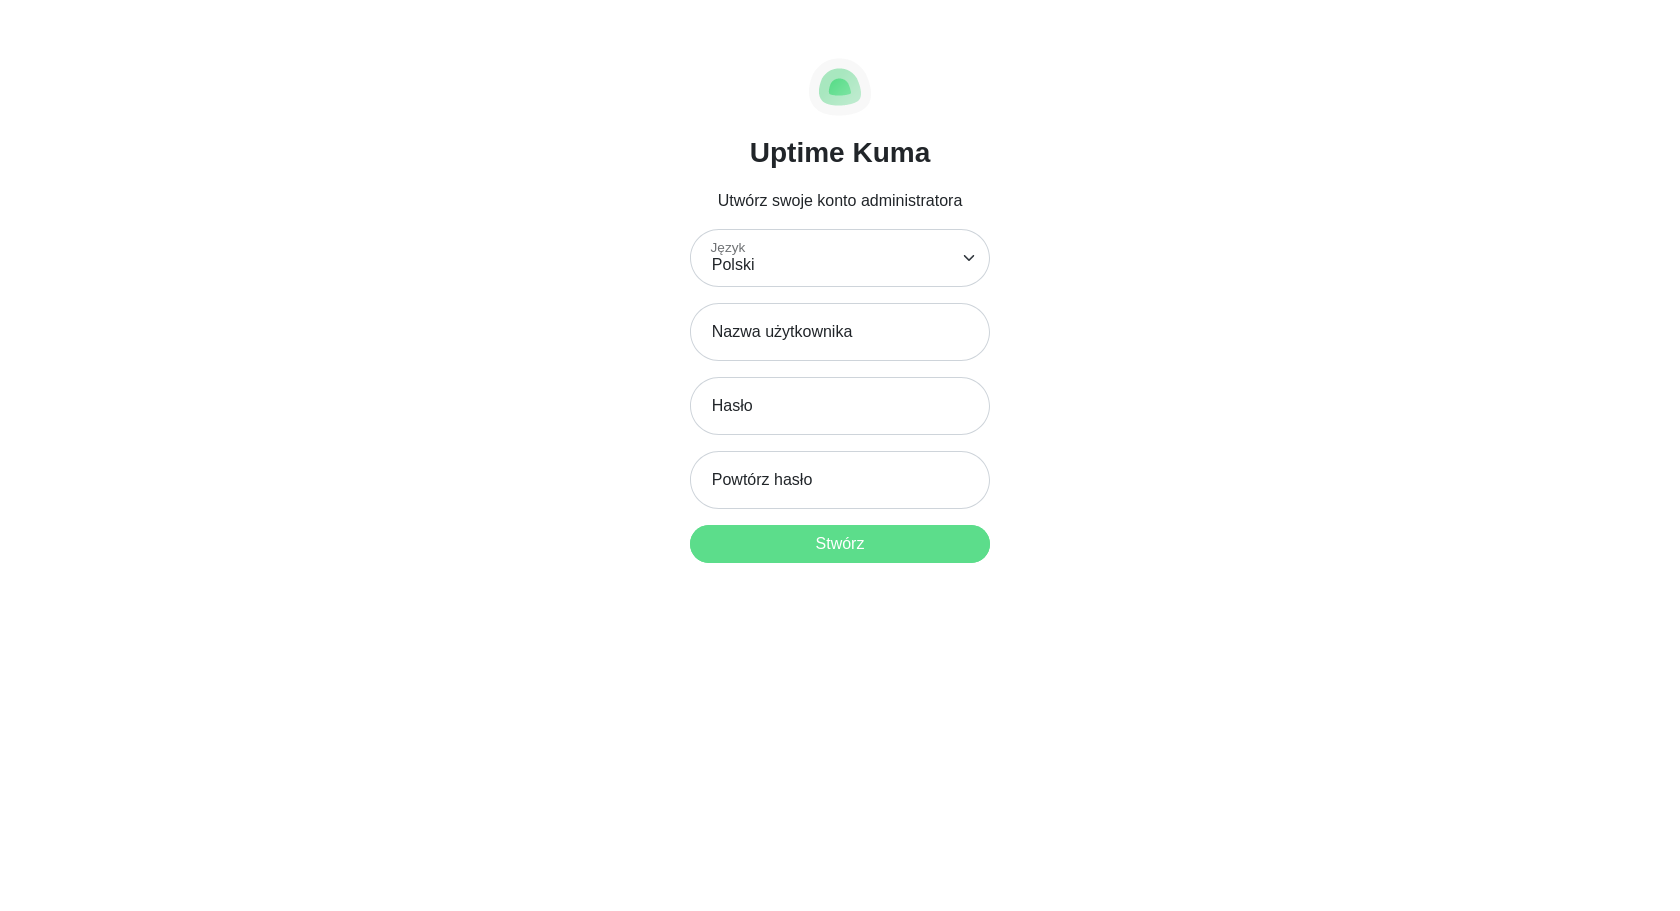
Upon accessing the specified address, you will be greeted by the standard installer, where you need to choose the language for the interface, set the administrator’s name, and password.
Basic Operation
The entire operation of the Uptime Kuma service revolves around creating monitors. Their task is to cyclically check whether the specified service, application, server, or even a Docker container is working correctly, i.e., whether it is running or, if you prefer, is alive. This is both a simple and extremely functional idea. I will create an example monitor to demonstrate how it works.
The most basic function that came to mind is to create a monitor that will check if my blog is running and functioning well. Click the Add Monitor button and then, in the displayed wizard, choose the Monitor Type as HTTP(s), give it a name, for example, Tomasz Dunia Blog, and enter the URL https://blog.tomaszdunia.pl. You can leave the rest of the parameters as default. Confirm the monitor creation by clicking the Save button.
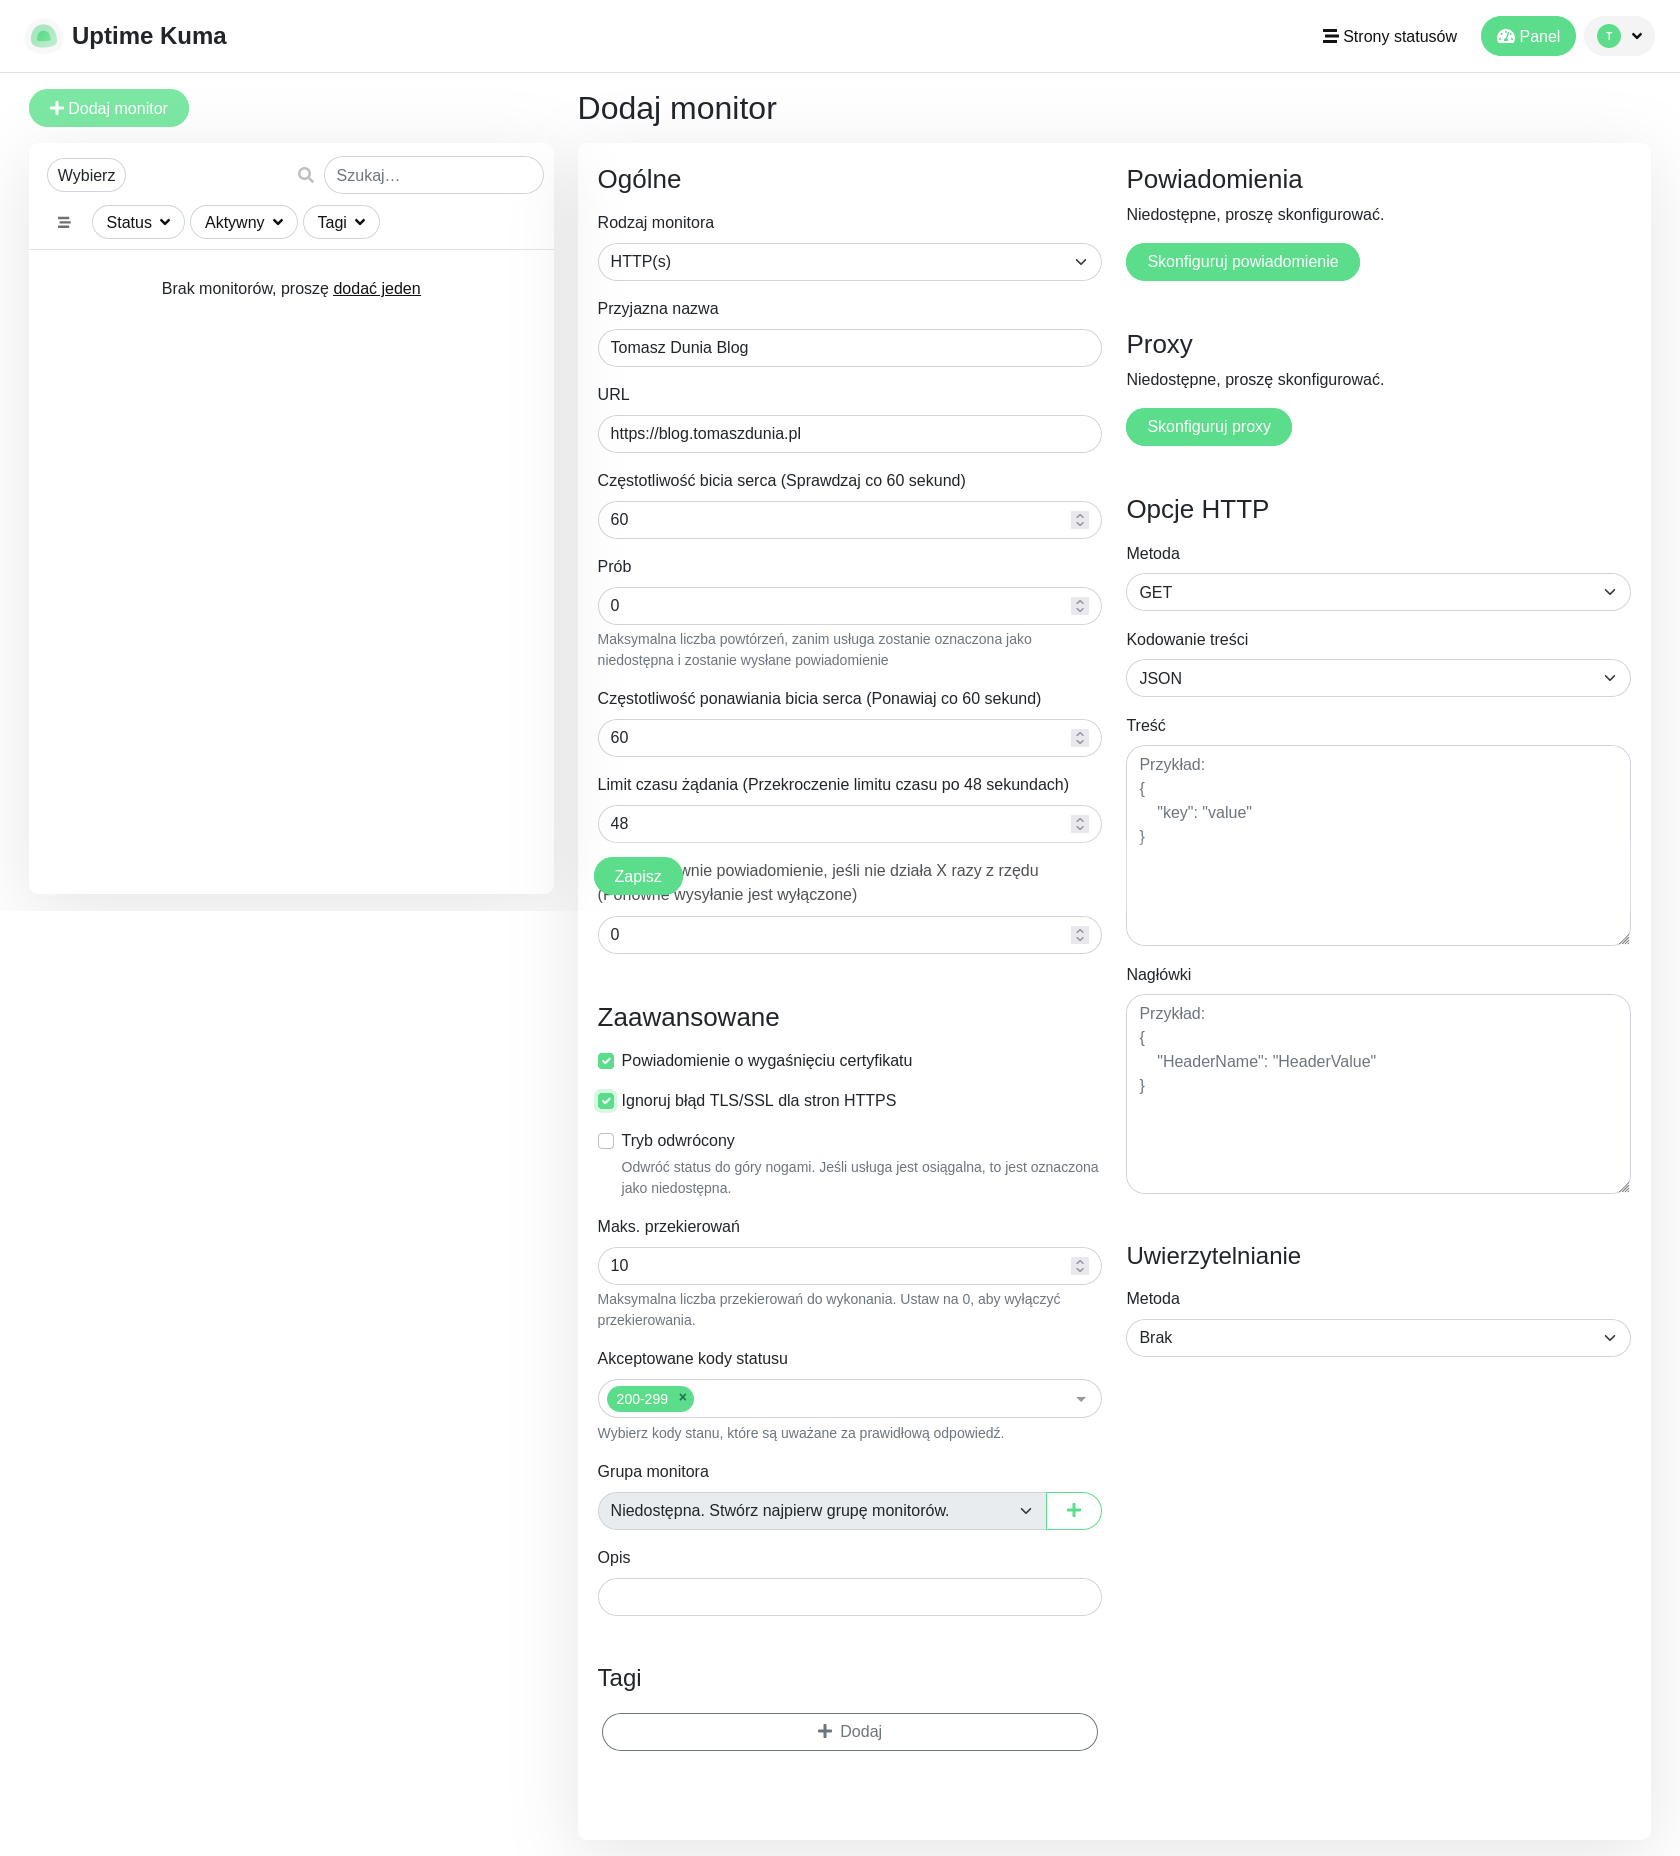
This monitor performs a very simple task. At intervals of 60 seconds, it visits the specified website address and retrieves the HTTP header, which contains the status code. Receiving a code within the range of 200-299 indicates that the website is functioning correctly. This information is then stored in the database, and the monitor waits another 60 seconds to repeat the same action in a loop. The collected data is presented as shown in the screenshot below.
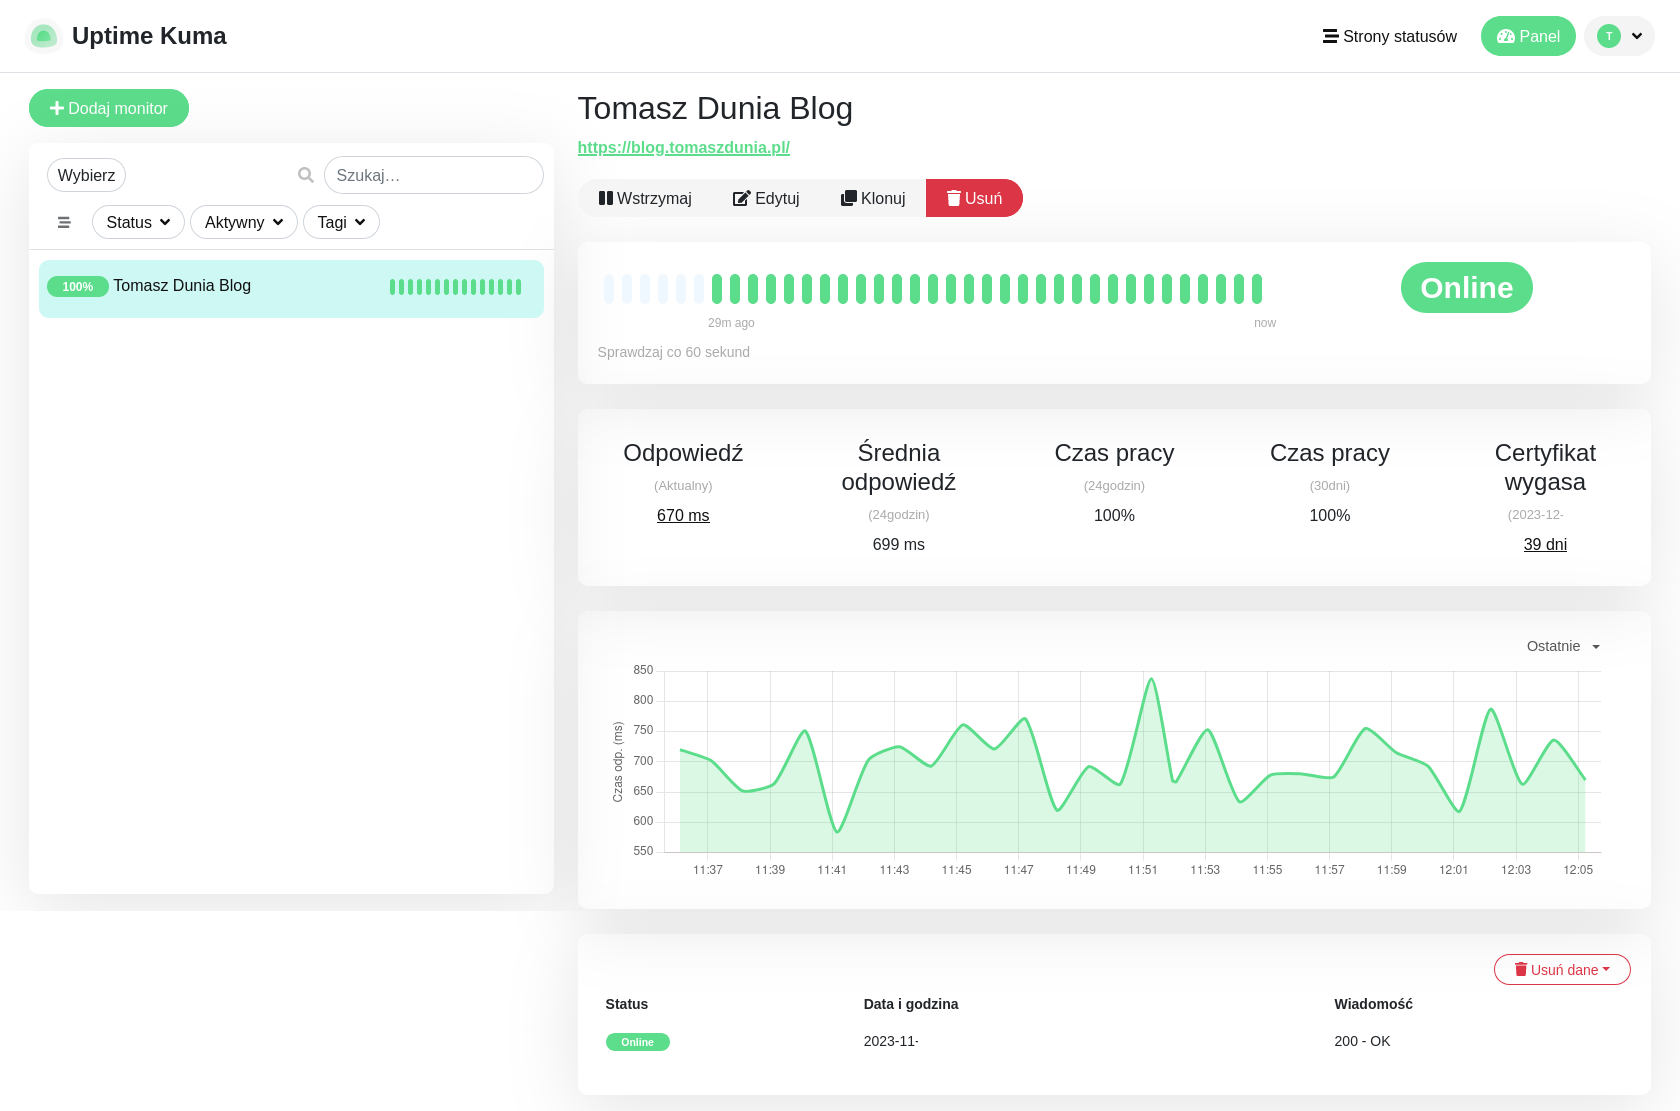
As you can see, the basic information includes the current status of the website and a bar displaying green lines (or red lines if there were any interruptions in operation) indicating previous statuses. In addition, the time in which page responds is measured and aggregated (along with a graph showing its shape in previous iterations), and the average working time is calculated.
Of course, I have shown only the basic and simplest application. Uptime Kuma allows for much more. For example, you can:
-
change the frequency of checks,
-
adjust the number of attempts before considering a failure,
-
specify the request timeout after which we assume no response will be received and stop waiting,
-
enable notifications informing that the monitored service is not functioning, this can be achieved through numerous methods supported by Uptime Kuma, such as sending notifications to a phone via dedicated apps or through messaging platforms like Telegram, Discord, or Signal,
-
specify the proxy through which requests should be sent,
-
define the method, or rather the type, of the request to be sent, content encoding, request content, and header,
-
determine the authentication method to be used to access the monitored resource,
-
request verification of the SSL certificate’s validity,
-
specify the maximum allowed number of redirects (particularly important when checking pages that lead us through a redirect loop before displaying their content),
-
determine acceptable status codes (not necessarily in the range 200-299),
-
group monitors,
-
create descriptions for monitors,
-
add tags to monitors.
There are quite a few advanced settings, aren’t there? And I’ve only listed those available for the HTTP(s) monitor type. There are many more types, but I won’t discuss all of them here.
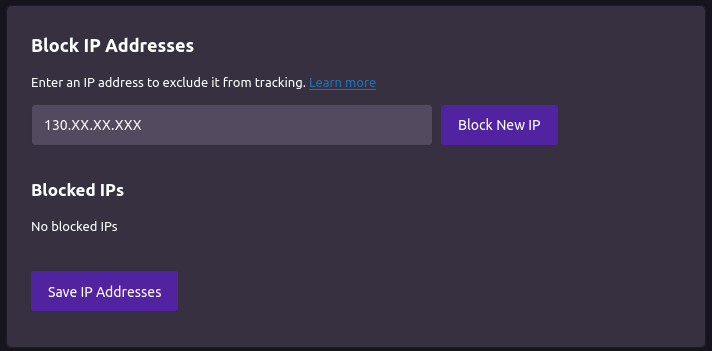
A tip at the End
Uptime Kuma is undoubtedly a very useful tool! However, it has one fundamental drawback. If you track visitor statistics on your site, they may be disrupted by monitoring. How so? Note that the default monitor does its job by visiting the site every 60 seconds. That’s 60 times per hour and 1440 times per day. Each such action looks and is counted in statistics as a normal visit to the site, like that of a blog reader. On very popular sites, this may be entirely unnoticed, but on niche sites like my blog, it would constitute a significant portion of the counted visits. The comforting thing is that, in most cases, there is a solution to this! On my blog, I use the Independent Analytics plugin for statistics. Why I chose this particular plug-in is described here. I’m wiriting about it, because it has a special option that allows me to exclude visits from a specific IP address from statistics. In practice, you should enter the IP address of the server where you have deployed Uptime Kuma, and you’re done. I believe that other statistics tools also have such a function, which should be available in their settings. The essential thing is to exclude the specific IP address from statistics, not to completely block its access to the site, as this would cause the Uptime Kuma monitor to stop working.